Signal
BULLISH · 74% confidence
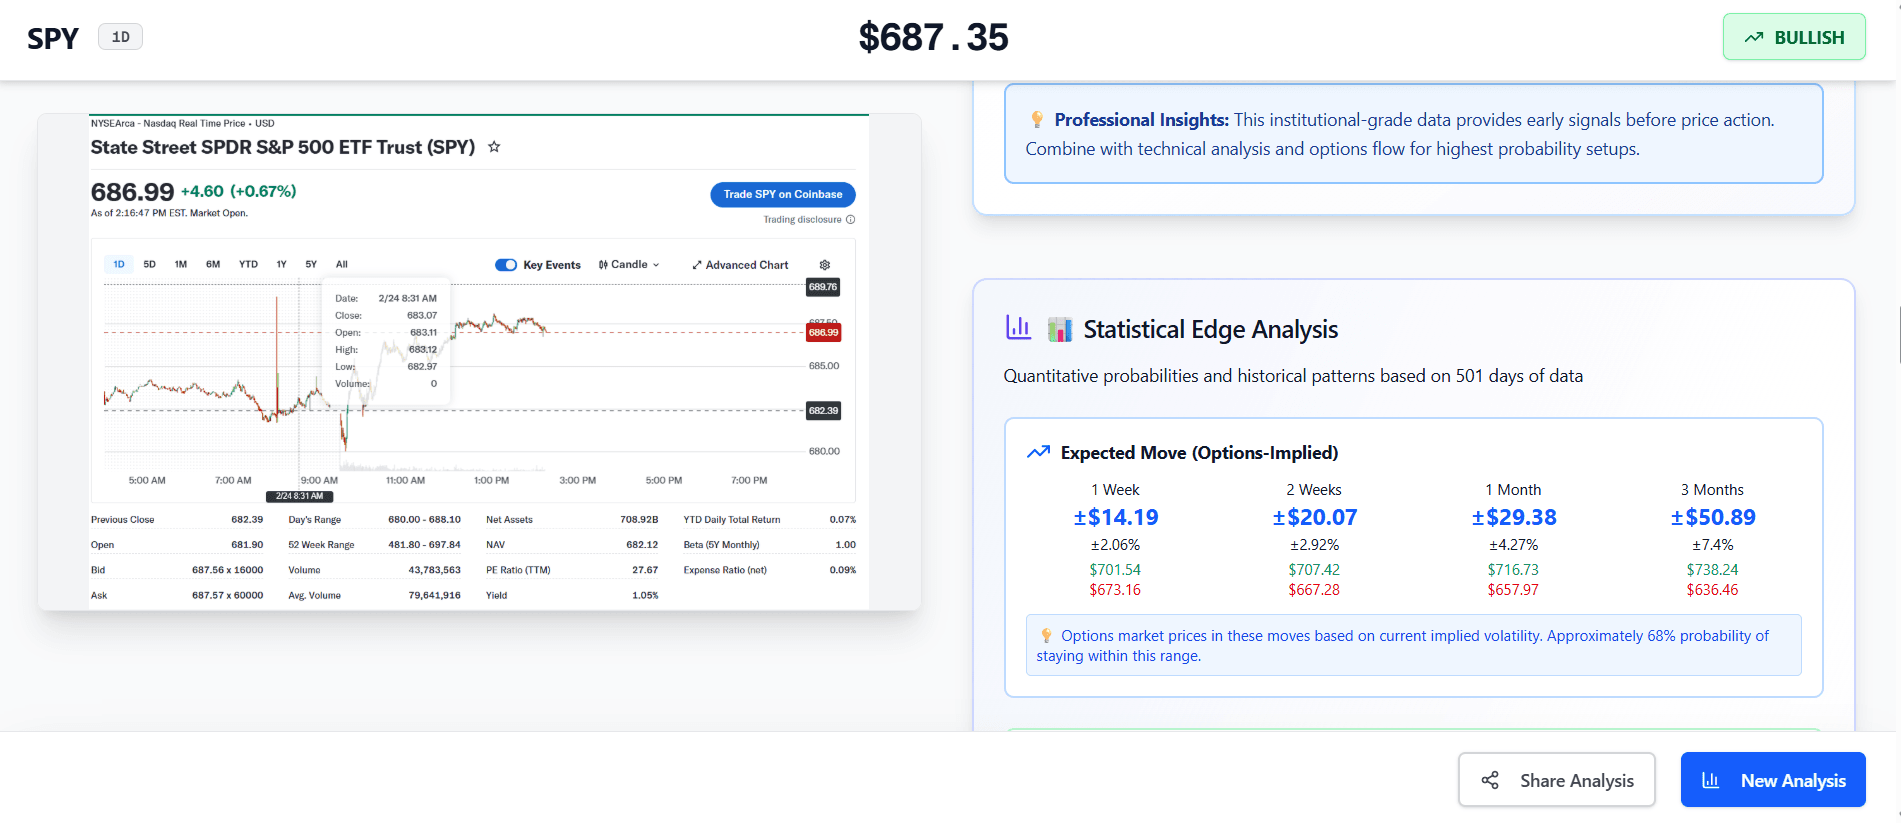
Expected Move
±3.2% this week
Every chart, one clear verdict
No more squinting at indicators trying to decide what they mean together. Stacked synthesizes price action, volume, and momentum into a single BULLISH or BEARISH call — with a confidence score, not a guess.
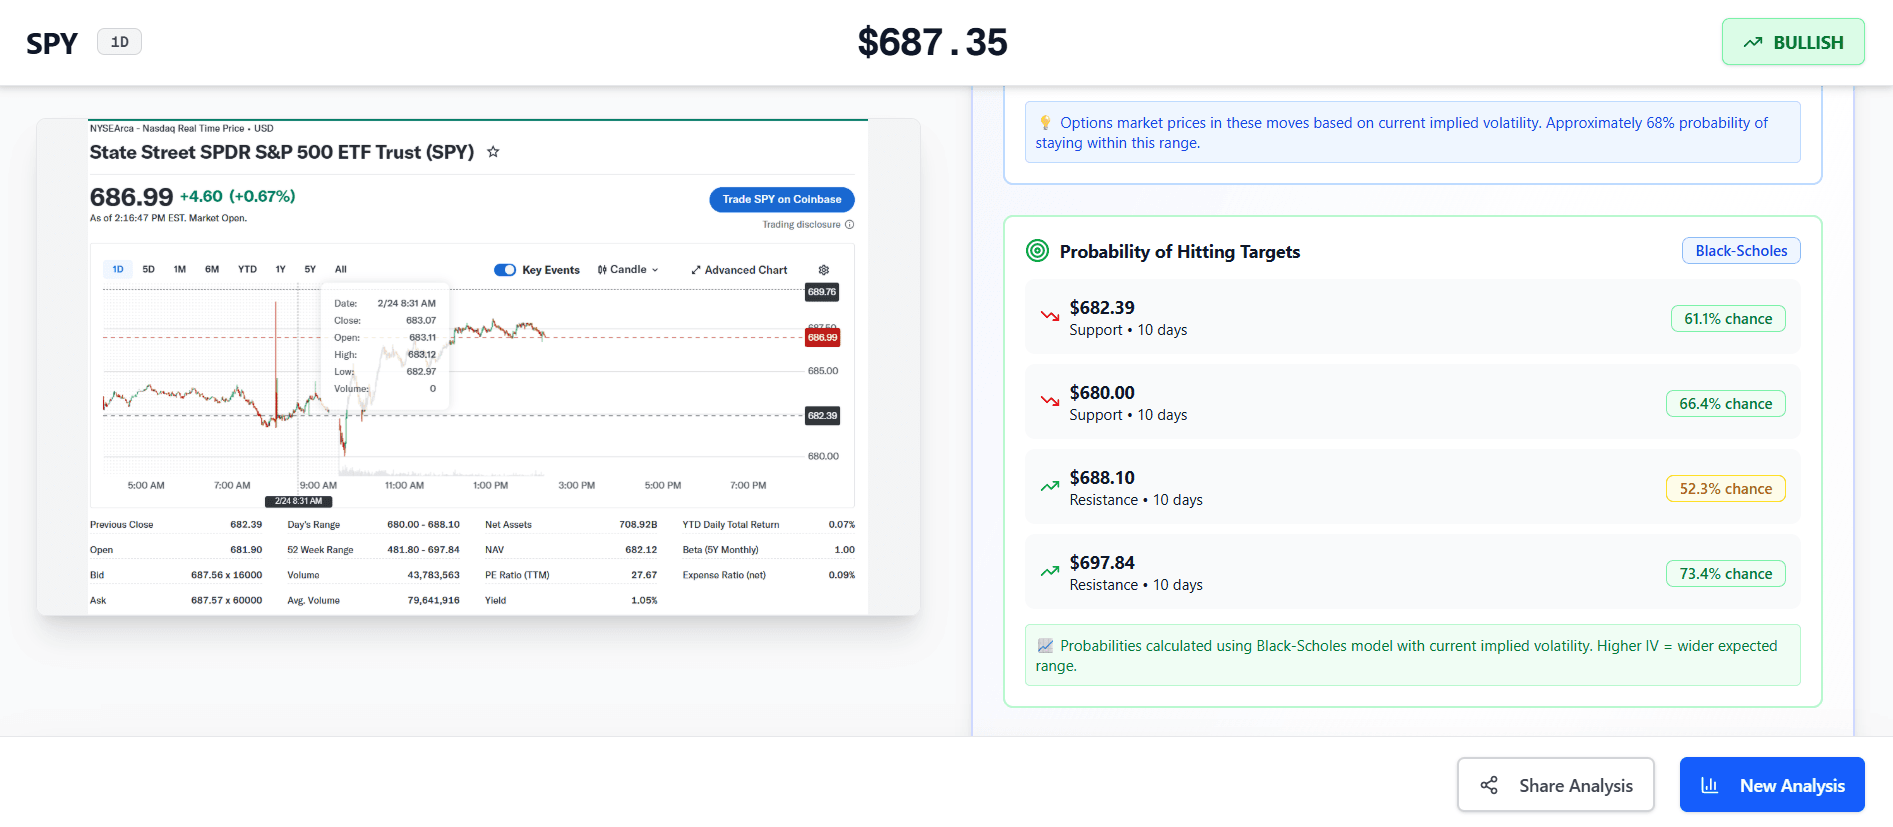
Know the odds before you trade the level
Every support and resistance level comes with a real hit-probability, calculated from live options data using the same Black-Scholes math hedge funds use to price risk — not a hand-drawn line on a chart.
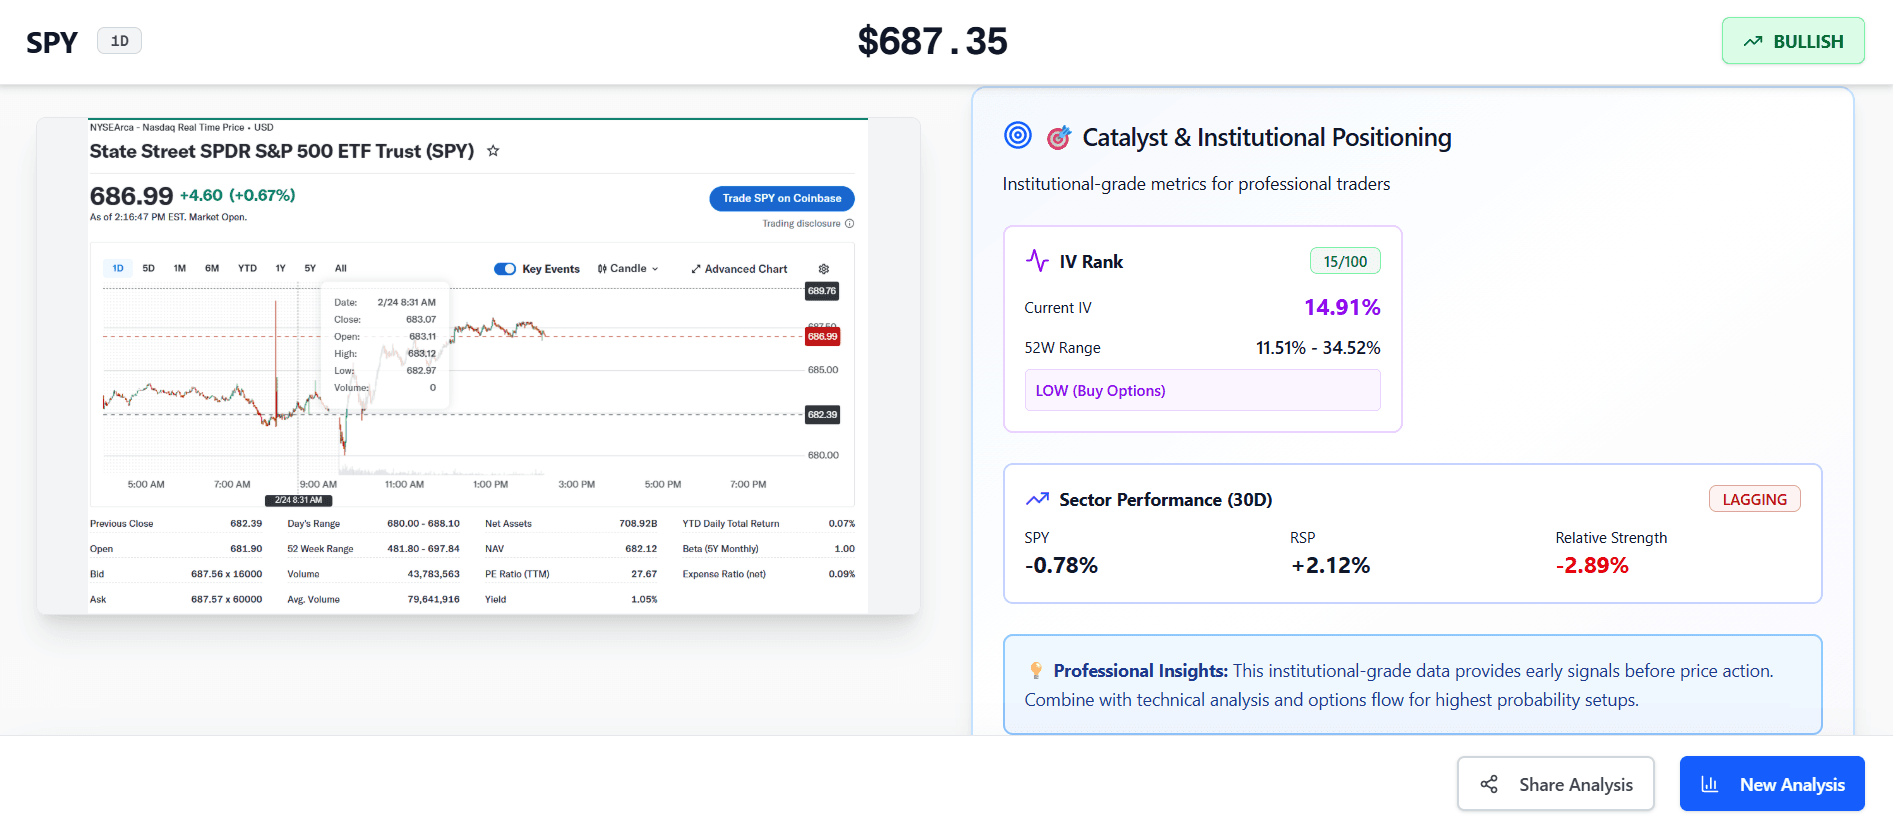
See what the smart money already knows
IV Rank, sector money flows, and catalyst analysis — the data institutions check before every trade — surfaced instantly, so you're never the last to know volatility is cheap or a sector is rotating.
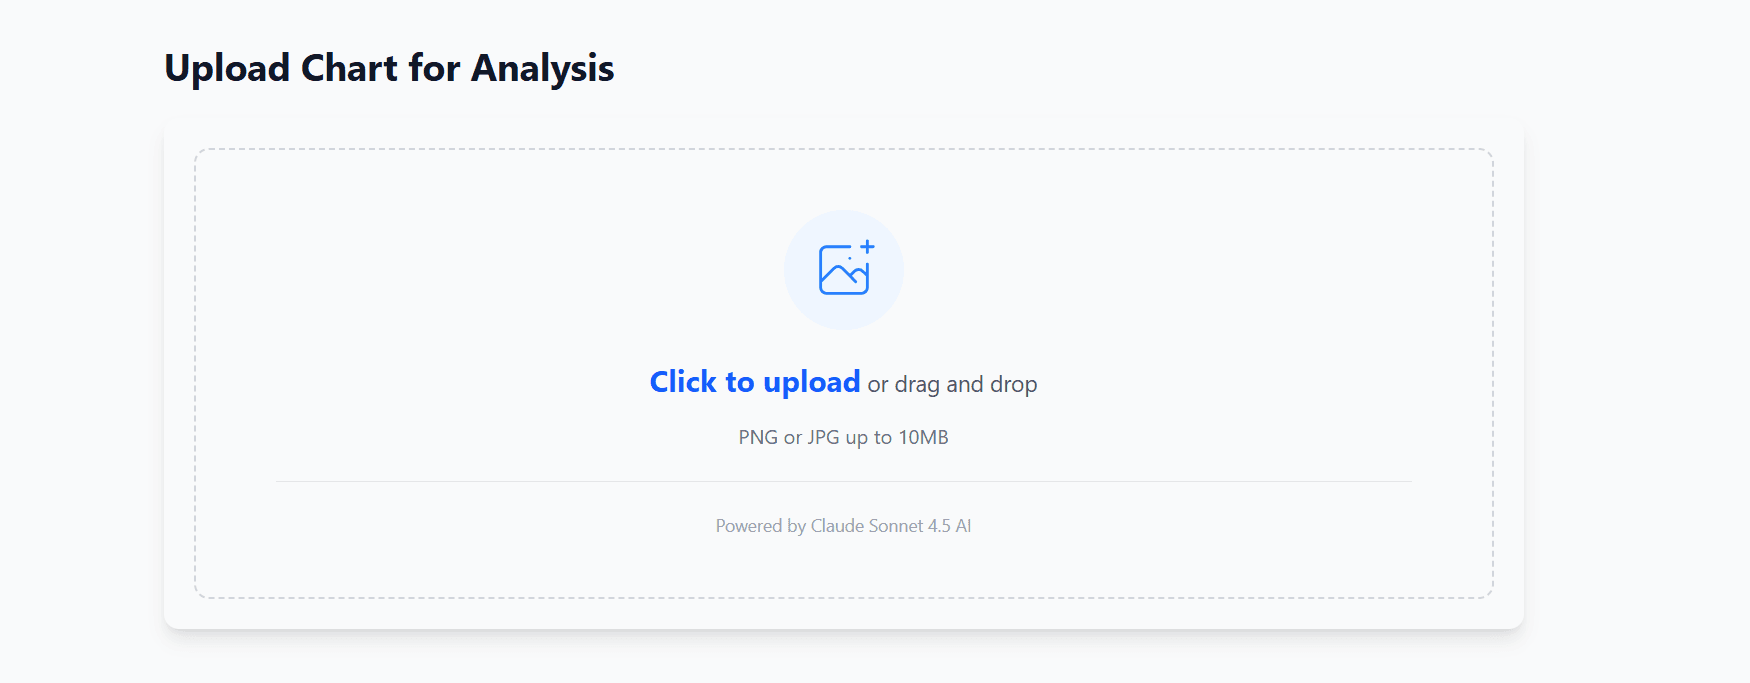
Drop in a chart. That's the whole workflow.
No API keys, no connecting a brokerage, no manual data entry. Screenshot any chart from any platform and Stacked handles pattern recognition, indicators, and market context automatically.
How It Works
Get professional-grade analysis in three simple steps
Upload Your Chart
Drag and drop or click to upload any trading chart screenshot. Supports all formats and timeframes.
AI Analyzes in Seconds
Our AI identifies patterns, calculates indicators, fetches market news, and detects key levels instantly.
Get Actionable Insights
Receive comprehensive analysis with technical indicators, support/resistance, and risk management.
Professional-Grade Features
Everything you need for confident trading decisions
Real-Time Indicators
VWAP, RSI, MACD, Bollinger Bands calculated from live market data.
Market News
AI-powered news fetching explains price movements with context.
Support & Resistance
Automatically identify key price levels with precision and confidence scores.
Volume Analysis
Visual volume comparisons and anomaly detection for better entries.
Risk Management
Identify potential risks and get stop-loss recommendations for every trade.
AI-Powered Insights
Claude AI synthesizes all data into clear, actionable trading recommendations.
Simple, Transparent Pricing
One plan. Unlimited analyses. Cancel anytime.
after your free trial ends
No charge for 7 days. Cancel anytime.
🔒 Secure payment via Stripe